


Market Pulse June 2026
A mixed June performance in financial markets
Global equity markets delivered mixed results in June as investors balanced resilient economic data against geopolitical uncertainty and elevated valuations. In Canada, the S&P/TSX Composite Index finished the month essentially flat, gaining roughly 0.3%. A strong performance from financials and energy helped offset weakness in materials and resource-related sectors as commodity prices remained volatile.
U.S. equities underperformed most major regions during the month. The S&P 500 declined approximately 1.1% (USD), ending a two-month winning streak. Profit-taking in large-cap technology and AI-related stocks weighed on returns, though market breadth improved and economically sensitive sectors generally held up better than the headline index suggested.
European equities were among the strongest performers. The STOXX Europe 600 Index advanced about 2.5%, supported by improving economic momentum, easing inflation pressures, and optimism surrounding monetary policy. Financials, industrials, and consumer sectors contributed positively to returns.
Emerging-market equities struggled, with the MSCI Emerging Markets Index falling roughly 1.5% (USD) over the month. Returns were pressured by volatility in Asian markets, investor caution toward global growth prospects, and periodic geopolitical concerns. Despite the June setback, emerging markets remained one of the strongest-performing regions on a year-to-date basis.
Canadian bonds generated modest gains in June as government yields were volatile but ended lower after the Bank of Canada held its policy rate at 2.25%, emphasizing weak growth despite inflation rising to 2.8%. U.S. Treasuries underperformed as the U.S. Federal Reserve maintained rates at 3.50%-3.75% and adopted a more hawkish stance, lifting inflation projections and pushing yields higher.
What if oil prices keep falling?
After everything we’ve seen on the oil supply front, it’s remarkable that WTI crude is only about $2 higher than it was on July 4 of last year. We generally believe oil and fossil fuels face secular headwinds as global electrification continues. However, the recent Middle East supply shock was among the largest in history, making oil's return to levels near those seen in February particularly noteworthy.
A few factors are worth considering. Governments around the world have released significant amounts of oil from strategic petroleum reserves, helping alleviate supply constraints. In addition, soft demand from China—which will likely recover—has helped reduce some of the supply-demand imbalance.
Stepping back, there are many drivers of oil prices beyond simple supply and demand fundamentals. Typically, greater supply results in lower prices and higher demand. Conversely, a reduction in supply can lead to higher prices even if demand weakens.
But oil prices are influenced by much more than physical market fundamentals. Commodity markets are heavily impacted by trend-following investors such as commodity trading advisors and momentum traders. When a commodity trend shifts from positive to negative, these investors often amplify the move. Traders are constantly taking long and short positions based on their expectations for future price movements, making oil markets highly sensitive to sentiment and positioning.
While we believe oil prices are low relative to the underlying fundamental backdrop, we also see challenges to revisiting prior highs above $100 per barrel. Negative price trends, fewer supply-related surprises, and investor interest shifting toward other opportunities may keep a lid on prices.
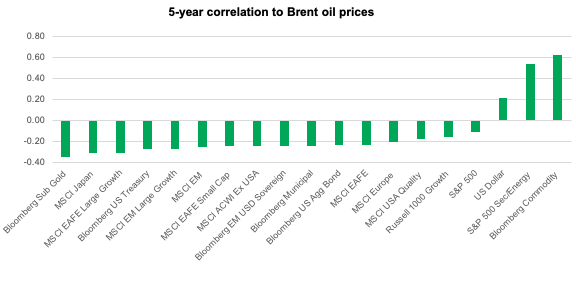
In the chart below, we highlight the five-year correlation between Brent crude and various asset classes. As the higher bars on the right side of the chart show, oil is positively correlated with commodities, energy stocks, and the U.S. dollar, while exhibiting an inverse relationship with equities and bonds.
 Navigate June's mixed markets with insights on oil, inflation, and investment opportunities.
Source: Morningstar
Over the first half of the year, the energy sector remained the best-performing sector in the S&P 500. Over the last month, however, it ‘s been the worst performer, alongside technology. Among the biggest potential beneficiaries of lower oil prices are gold (as trend-following investors appear to be rotating back toward the metal), the MSCI EAFE Large Cap Growth Index—with Japan as a key component—and, on the fixed-income side, emerging-market debt, municipal bonds, and the U.S. Aggregate Bond Index.
What to watch
Investors may consider monitoring three key themes as markets progress through the second half of 2026:
1. Corporate earnings season
Management guidance could play a significant role in complementing reported results, especially following June's performance in large-cap technology and AI-related stocks.
2. Inflation and central bank expectations
Investors may monitor upcoming inflation reports to assess whether price pressures remain contained. Deviations in inflation trends might influence expectations for future Fed, BoC, and ECB policy decisions, potentially impacting bond yields and equity valuations.
3. Geopolitical risks
Events in the Middle East, relations between major economic powers, and commodity market volatility remain potential catalysts for market swings. June demonstrated how quickly geopolitical developments can affect energy prices and risk sentiment.
Overall, July is likely to be driven by the interaction between earnings, inflation, and central bank expectations. If earnings remain resilient and inflation continues to moderate, equities could resume their upward trend. However, current valuations leave markets vulnerable to disappointment, particularly in the U.S. growth and technology sectors.
Monthly lookahead
July 8 | U.S. FOMC meeting minutes, May consumer credit |
July 10 | Canada June employment, May building permits |
July 14 | U.S. June CPI |
July 15 | Canada BoC interest rate decision, U.S. Fed Beige Book, June PPI |
July 16 | Canada June housing starts, U.S. June retail sales |
July 17 | U.S. July U. of Michigan Consumer Sentiment, June industrial production |
July 20 | Canada June CPI |
July 23 | Canada May retail sales |
July 29 | U.S. Fed interest rate decision |
Important disclosure
It is not possible to invest directly in an index. Past performance does not guarantee future results.
Investing involves risks, including the potential loss of principal. Financial markets are volatile and can fluctuate significantly in response to company, industry, political, regulatory, market, or economic developments. The information provided does not take into account the suitability, investment objectives, financial situation, or particular needs of any specific person.
All overviews and commentary are intended to be general in nature and for current interest. While helpful, these overviews are no substitute for professional tax, investment or legal advice. Clients and prospects should seek professional advice for their particular situation. Neither Manulife Wealth Inc. nor any of its affiliates or representatives (collectively Manulife Investments) is providing tax, investment or legal advice.
This material is intended for the exclusive use of recipients in jurisdictions who are allowed to receive the material under their applicable law. The opinions expressed are those of the author(s) and are subject to change without notice. Our investment teams may hold different views and make different investment decisions. These opinions may not necessarily reflect the views of Manulife Wealth Inc. The information and/or analysis contained in this material has been compiled or arrived at from sources believed to be reliable, but Manulife Wealth Inc. does not make any representation as to their accuracy, correctness, usefulness, or completeness and does not accept liability for any loss
arising from the use of the information and/or analysis contained. The information in this material may contain projections or other forward-looking statements regarding future events, targets, management discipline, or other expectations, and is only current as of the date indicated. The information in this document, including statements concerning financial market trends, are based on current market conditions, which will fluctuate and may be superseded by subsequent market events or for other reasons. Manulife Investment Management disclaims any responsibility to update such information.
Manulife Wealth Inc. shall not assume any liability or responsibility for any direct or indirect loss or damage, or any other consequence of any person acting or not acting in reliance on the information contained here. This material was prepared solely for informational purposes, does not constitute a recommendation, professional advice, an offer or an invitation by or on behalf of Manulife Wealth Inc. to any person to buy or sell any security or adopt any investment approach, and is no indication of trading intent in any fund or account managed by Manulife Wealth Inc. No investment strategy or risk management technique can guarantee returns or eliminate risk in any market environment. Diversification or asset allocation does not guarantee a profit or protect against the risk of loss in any market. Unless otherwise specified, all data is sourced from Manulife Wealth Inc. Past performance does not guarantee future results.
Manulife, Manulife & Stylized M Design, Stylized M Design, Manulife Wealth and Where will better take you are trademarks of The Manufacturers Life Insurance Company and are used by it, and by its affiliates, under license.
5726862